6.0 Detailed Approach and Methodology
6.1 Framing the Approach
Two key decisions were made that frame our approach to quantifying the emissions associated with our housing intervention programs. Firstly, the home improvements are compared to a new construction baseline. For each house, the emissions associated with the intervention are calculated relative to construction of a new house in the same location with an equivalent level of resilience.
Secondly, we have only considered the upfront embodied carbon emissions, those from lifecycle stages A1-A5 (material extraction, processing, and construction) in Figure 4. The emissions associated with building operations during habitation, such as energy use from cooking, heating, cooling, and lighting, are not considered, nor are the emissions associated with building end of life.
The details and reasoning behind this approach are provided in the following two subsections 6.1.1 and 6.1.2
6.1.1 Emissions Are Compared to a New Construction Baseline
For each house, the emissions associated with the intervention are calculated relative to construction of a new house in the same location with an equivalent level of resilience.
In most cases, new construction is the most likely alternative to retrofit. Build Change’s housing improvement programs typically fall into one of two contexts: post-disaster, focused on housing reconstruction; and prevention, where housing in disaster-prone areas is strengthened before a disaster occurs. In both scenarios, new construction is the most common solution to the problem of inadequate housing.
Post-disaster, decision-makers such as governments, the private sector, and aid agencies have typically tended to demolish or abandon damaged housing and build new homes. “Doing nothing” is not an option as the level of damage means houses are either unsafe or (at best) uncomfortable for habitation. Often houses are damaged because of deficiencies in their original design, so repairing the damage and restoring the house to its pre-disaster condition is not appropriate either; the house will be damaged again in future disasters.
In prevention contexts, apathy toward the risk often leads to a “do nothing” approach. However, the potential consequences of high human and economic losses mean that, in reality, “do nothing” is not an option. When faced with the choice of how to act, an absence of technical guidance and regulation on improving existing buildings combined with the greater publicity opportunities offered by new, large-scale developments often leads developers, builders, homeowners, and governments to opt for new construction.
A relative approach standardizes the results and allows compilation and comparison on a global scale. Build Change has implemented housing projects and programs in 26 countries across four continents. Housing design and construction varies considerably around the world, and, correspondingly, so do our retrofit designs. By always comparing our retrofit intervention against resilient new construction with a similar performance level, it allows us to compile the results into a single, international database and compare the impact of different contexts and program features.
Considering the results relative to a baseline addresses many of the challenges of uncertain or absent data. Carbon emissions accounting in construction is a relatively new activity that is largely concentrated in Europe and North America. In the countries and regions in which Build Change works, very few materials producers issue environmental product declarations (EPDs) or self-declarations that contain the data required for precise calculation of the embodied carbon. Globally, no published national or international data for structural housing retrofit could be found to use as a benchmark. Using the same data to calculate the emissions associated with new construction as for retrofit for the same location cancels out inaccuracies when we measure the relative difference between the two interventions.
6.1.2 Only the Upfront Carbon Emissions Are Considered
The analysis considers only the embodied carbon emissions associated with lifecycle stage A, the emissions from stages B, C and D are not considered.
The primary reason for only considering stage A emissions is that our focus is on quantifying the difference between improving an existing home and building new. We are assuming that, in most scenarios studied here, the emissions from stages B, C and D will be the same or very similar for a new house as for a retrofitted house, so when the two are compared, stage B, C and D emissions will cancel out.
From experience, we know that homeowners do not significantly alter their energy supply or usage following a retrofit intervention, so there is little difference to the stage B operational emissions. Even in cases where the intervention includes expansion, for example by adding a second story, the change in operational carbon is negligible compared to embodied carbon.
Similarly, we know that building emissions during end of life and beyond (stages C and D) are very similar for retrofitted and equivalent new houses. Although the cause of end of life may result in different emissions,[1] the emissions associated with end of life will still be the same regardless of whether the house was an improved existing house or a new construction.
Secondary reasons for only considering stage A emissions are as follows:
-
Embodied carbon emissions due to materials and construction (stages A1–A5) account for the majority of a building’s emissions over its life cycle. Estimates for the UK indicate that stages A1-A5 account for 55 percent of total emissions (see Figure 4). This proportion would be even higher in the countries where Build Change operates, where operational energy use and refurbishment levels are much lower than the UK.
-
Recent technological advancements and regulations have significantly reduced operational carbon as a proportion of whole life carbon. The global construction industry has significantly decreased operational carbon in the built environment in recent years. Advancements in reducing embodied carbon have been slower, and as a result embodied carbon is increasingly accounting for a higher proportion of whole building life cycle emissions.[2]
-
There is limited data available for building emissions during stages B, C, and D, as Build Change is not (currently) tracking how buildings are used beyond construction completion. For example, we do not know if homeowners add additional electrical appliances, or install solar panels. Nor do we know whether they choose to recycle materials at building end of life, or whether everything is sent to landfill.
-
Houses in Build Change programs have very low in-use consumption. Typically, the houses in our programs have low operational emissions—they have few electrical appliances, and they usually do not have air-conditioning or heating. Simple estimates indicate that operational emissions would account for a very low percentage of total life emissions.
6.2 Calculation Approach
For the reasons described in Section 6.1, the analysis considers only the emissions from lifecycle stages A1-A5, not stages B, C or D.
The analysis is based predominantly on guidance from the UK Institution of Structural Engineers’ “How to Calculate Embodied Carbon”, 2nd edition, published in 2022. This document is aligned with British Standards for sustainable construction: BS EN 15978,[3] BS EN 15804.[4] The following sections detail how the guidance was applied to calculations of embodied carbon savings for Build Change’s as-built housing dataset.
6.2.1 Stages A1–3, Production and Transport of Raw Material:
For stages A1–A3 (raw material supply, transport, and manufacturing), the embodied carbon of each material was calculated as follows:
Embodied CarbonA1-A3 (kg∙CO2e) = Material Quantity (kg) • Embodied Carbon FactorA1-A3 (kg∙CO2e/kg)
Material quantities were taken from the construction bill of quantities (only built projects have been considered).
The embodied carbon factors were selected from a range of sources following significant research and consideration. As much as possible, we have used material- and producer-specific EPDs or self-declarations However, the majority of the materials suppliers used by homeowners that are involved with Build Change programs were unable to supply EPDs when contacted. In the countries where Build Change works, there is not yet sufficient demand nor regulation requiring materials producers or importers to provide this information to customers.
Where EPDs are not available, we have used two databases as our primary data source:
-
the Inventory of Carbon and Energy database V3 (ICE3),[5] and
-
the Embodied Carbon in Construction Calculator (EC3) database.[6]
Both databases are among the most well regarded and complete of all EPD and embodied carbon factor databases currently available internationally.
6.2.2 Stage A4, Transport to the Construction Site:
Stage A4 considers the transport of materials or products from the factory gate to the construction site, and the transport of construction equipment (cranes, scaffolding, etc.) to and from the site. Similar to stages A1-A3, the embodied carbon for stage A4 is calculated for each material as follows:
Embodied CarbonA4 (kg∙CO2e) = Material Quantity (kg) • Embodied Carbon FactorA4 (kg∙CO2e/kg)
Where the Embodied Carbon Factor for stage A4 is calculated as follows:
Embodied Carbon FactorA4 = ∑mode (TDmode • TEFmode)
TDmode is the transport distance for each transport mode considered and TEFmode is the Transport Emission Factor (TEF) for each transport mode considered.
The mode of transport is known for all Build Change programs and the distance traveled is estimated to the nearest 100 kilometers based on known origin and final destinations. The TEF is based on UK transportation emissions as follows:
| Mode of transport (km) | Road | Sea | Freight Air | Rail |
|---|---|---|---|---|
| Transport Emissions Factor (TEF), kgCO2e/kg | 0.1065 | 0.01614 | 0.59943 | 0.02556 |
Source: IStructE How to Calculate Embodied Carbon
6.2.3 Stage A5, Construction:
The embodied carbon associated with the construction installation process (stage A5) is calculated based on two key sources of emissions, as follows:
Embodied CarbonA5 (kg∙CO2e) = Embodied CarbonA5w (kg∙CO2e) + Embodied CarbonA5a (kg∙CO2e)
- A5w: The emissions associated with the volume of each material that is wasted on site. The total weight of each material is multiplied by a waste rate factor. The waste rate factors that have been adopted for all case studies are those recommended in the IStructE’s Structural Carbon Tool and are presented in the table below.
| Material/Product | WR (waste rate) |
|---|---|
| Concrete in situ | 5.0% |
| Mortar | 5.0% |
| Screed | 5.0% |
| Steel reinforcement | 5.0% |
| Steel frame (beams, columns, braces) | 1.0% |
| Concrete blocks | 20.0% |
| Brick | 20.0% |
| Stone | 10.0% |
| Timber frames (beams, columns, braces) | 1.0% |
| Timber floors (joists, board) | 10.0% |
| Timber formwork | 10.0% |
| Glass | 5.0% |
| Plasterboard (for boarding) | 22.5% |
- A5a: Emissions due to general construction activities, for example the energy use from machinery and temporary site offices. International guidance to calculate emissions from construction activities recommends using a construction activities emission factor that is multiplied by the project cost. This methodology, however, has been developed for regions where the project cost is orders of magnitude higher than the housing retrofits that Build Change implements. For this reason, it was not felt to be appropriate. Instead, we have developed an alternate methodology, more appropriate for the regions in which we work. We have defined and calculated the emissions associated with three levels of construction site activities, as shown below. For each program or project analyzed, the most appropriate of the three levels has been adopted to account for emissions associated with the construction process.
| Level of Activity | Description | Applicable Countries | Emissions (kgCO2e per site) |
|---|---|---|---|
| 1 – Very low | No or almost no energy use on site. Concrete mixed by hand witd shovels; no use of power tools, cranes, or generators. All works, including concrete mixing, carried out by hand. | Haiti | 50 |
| 2 – Low | Low energy consumption on site. Limited use of a diesel generator to power a site mixer for concrete production, lights, and some power tools. No use of cranes, excavators, or otder heavy machinery. | Honduras, Nepal, Philippines | 200 |
| 3 – Average | Average energy consumption on site. Regular use of a diesel generator on site to power lights and tools. Ready mix concrete delivered to site. Very limited, if any, use of cranes, excavators, or otder heavy machinery. | Colombia, Sint Maarten | 550 |
6.3 Calculation Tools
For most programs, we calculated the embodied carbon emissions associated with stages A1–5 using simple spreadsheets. However, with the support of Autodesk and the Autodesk Foundation, we developed digital tools to semi-automate embodied carbon calculations in Revit. These tools will be integrated into our Building Information Modelling workflow for all future projects in Revit. They will greatly facilitate the collection of emissions data and provide real-time information to our engineers about the environmental impact of design decisions.
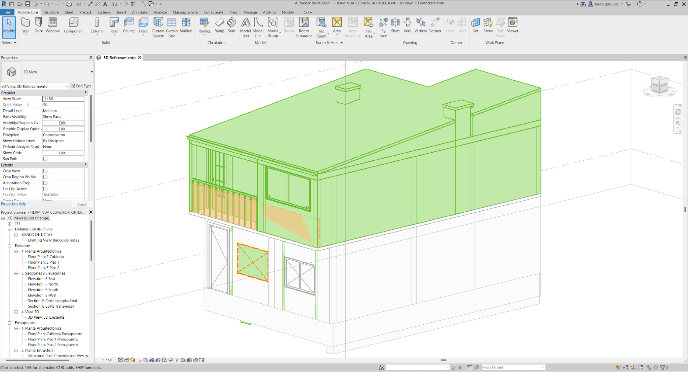
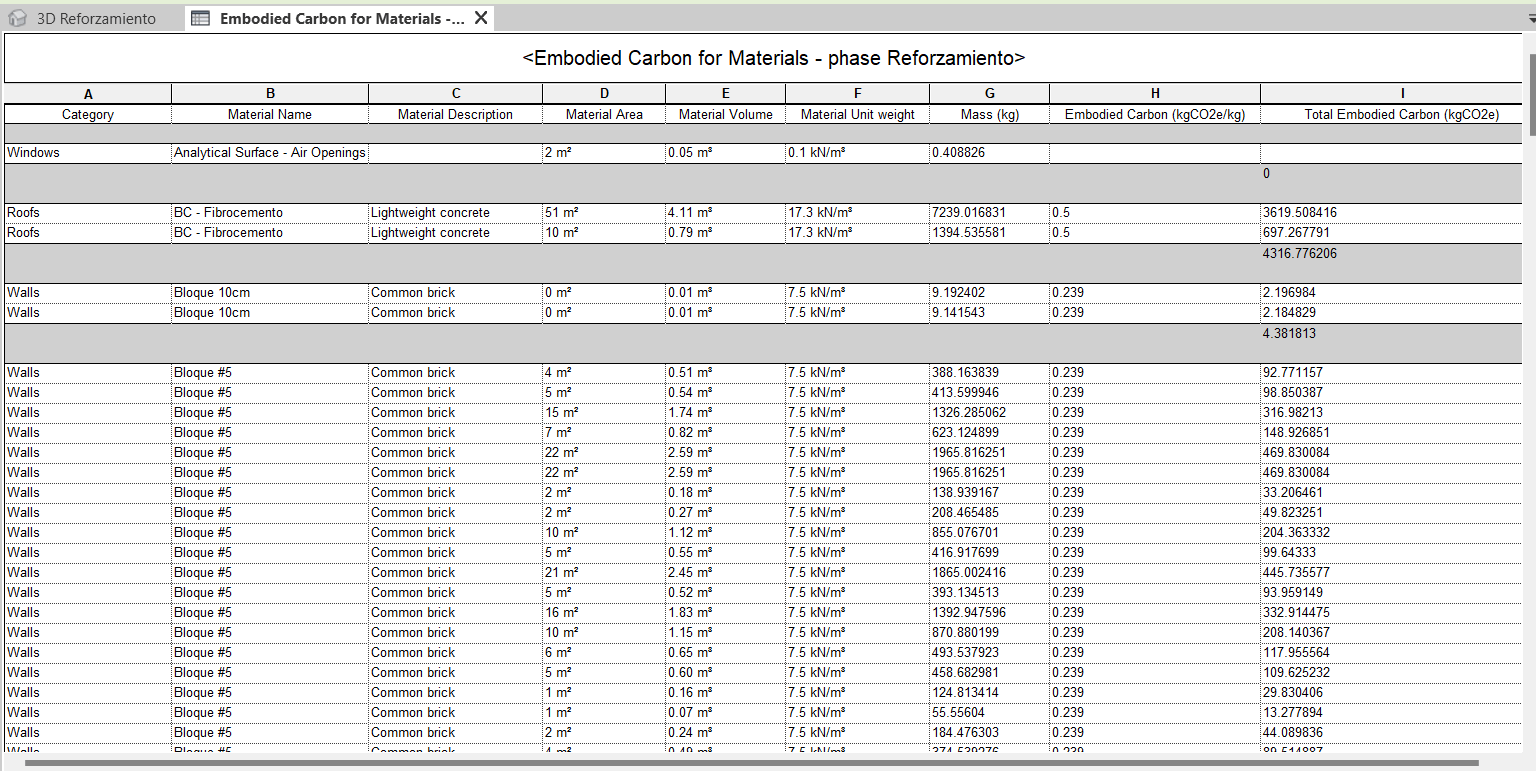
Revit was used to semi-automate embodied carbon calculations
6.4 Calculation Limitations
It is important to note the following limitations with this analysis:
-
The probability of damage in preventative contexts is not considered. In both post-disaster and prevention contexts, the emissions savings from a home improvement intervention were compared to new construction as a baseline. Ideally, the probability of future damage occurring would also be factored into the comparison. However, the multi-hazard nature of the project locations puts this consideration beyond the scope of this study.
-
The majority of the material emissions factors were obtained from global or regional meta databases and as a result are not specific to the exact materials and supplier used. Unfortunately, this was not a choice. Carbon accounting is not yet commonplace in Build Change’s program locations, and none of the suppliers contacted were able to provide data. Depending on the material, there can be a very large range in the magnitude of the emissions factor and large differences can even exist between different providers in the same region. This is especially true for timber, corrugated galvanized iron (CGI), and galvanized profiles, for which global average data from the ICE3 database was used. The impact of using the global average data for these materials was deemed acceptably low as these materials are not significant contributors to the overall home improvement emissions (see Figure 11).
-
Historical emissions data was not used. The production processes of materials change over time —hopefully for the better—and as a result the materials emissions factor may also change. However, historical data was largely not available for the materials and site locations of Build Change projects. For example, many Haiti home retrofits were completed in 2013, but material data from 2022 was used. Given that average values were used, this is not expected to have a significant effect on the results.
References
- For example, the amount of emissions from an end of life caused by a fire is different from the end of life caused by an earthquake, or a hurricane. Houses damaged beyond repair and retrofit following an earthquake often still have salvageable elements, such as window and door frames, that can be reused or recycled. Following a fire, there is no such option to reuse or recycle materials. ↩
- Buildings Performance Institute Europe. Whole-life Carbon: Challenges and solutions for highly efficient and climate-neutral buildings (2021). https://www.bpie.eu/publication/whole-life-carbon-challenges-and-solutions-for-highly-efficient-and-climate-neutral-buildings/ ↩
- British Standards Institution. BSEN15978:2011: Sustainability of construction works. Assessment of environmental performance of buildings. Calculation method. London: BSI, 2011. ↩
- British Standards Institution. BSEN15804:2012+A2:2019: Sustainability of construction works. Environmental product declarations. Core rules for the product category of construction products. London: BSI, 2021. ↩
- The ICE database is a meta-database, based on data from an extensive literature review led by Dr Craig Jones (circular ecology) and Professor Geoffrey Hammond (University of Bath). Eighty-eight percent of the data reviewed is EPDs in accordance with EN 15804 (the majority of the remainder are to ISO 14067, ISO 14044, or claim no standardized method). ↩
- The EC3 tool contains a freely accessible database of EPDs from materials producers, predominantly in North America but also globally. Embodied carbon factors are grouped by material type, the range and average of values can be easily viewed, and values can also be viewed by region. EC3 was incubated at the Carbon Leadership Forum with input from nearly 50 industry partners. It is now owned and managed by Building Transparency. ↩